

Most businesses are drowning in data but starving for insight. You might have spreadsheets full of numbers, dashboards that update in real time, and reports nobody reads. Performance analytics is the discipline that turns that chaos into clarity. It’s not about collecting more data. It’s about collecting the right data and using it to make decisions you actually trust.
For a long time, companies ran on gut feelings. A manager sensed sales were slipping. HR thought morale was fine. Marketing guessed which campaign worked best. That approach rarely scaled. Performance analytics replaces guesswork with evidence. It gives every department a shared language for what success looks like and how close they are to reaching it.
This guide breaks down what performance analytics really means, why it matters across every function, and how to use it without getting lost in jargon. Whether you’re leading a team, running marketing campaigns, or trying to improve hiring outcomes, you’ll find something here you can use.
What Is Performance Analytics?
Performance analytics is the practice of measuring, analyzing, and interpreting data related to how a business, team, or individual performs against defined goals. It pulls from real-time and historical data sources to give a clear picture of what’s working and what isn’t.
At its core, it answers three questions. Are we hitting our targets? If not, why? And what should we do differently tomorrow? The best performance analytics doesn’t just describe the past. It points toward smarter future action.
Performance data analytics covers the technical side of collecting, cleaning, and visualizing that information. The outcome is always the same: turning raw numbers into insights that someone can actually use.
Why Performance Analytics Matters
Decisions backed by solid data tend to beat decisions made on instinct. That’s not a knock on experience. It’s just that human memory is selective and bias is real. Performance analytics gives you an objective foundation.
Companies that use analytics well spot problems earlier. A dip in sales pipeline gets flagged before it becomes a revenue miss. A drop in employee engagement shows up in workforce data long before people start quitting. You get lead time to act.
It also helps with efficiency. When you can see how resources are actually being used, redundancies become obvious. Forecasting improves because you’re not projecting from hope. You’re modeling from patterns. In a competitive market, that edge compounds fast.
Types of Performance Analytics
Performance analytics isn’t one monolithic thing. It splits into several specialties, each focused on a different slice of the organization. Understanding these types helps you apply the right lens to the right problem.
- Business performance analytics
- Workforce performance analytics
- Team performance analytics
- HR performance analytics
- Marketing performance analytics
- Sales performance analytics
Each one uses similar analytical principles but answers different questions. Let’s walk through them individually so you can see where they apply to your company.
Business Performance Analytics
Business performance analytics looks at the big picture. Revenue trends, operational efficiency, profitability by product line, and overall financial health sit at the center. Executives and leadership teams rely on this to steer the organization.
Key performance indicators get tracked through business intelligence dashboards. Those dashboards pull data from accounting systems, CRMs, and operations platforms. When a quarterly number slips, the drill-down capability lets you ask why and find the root cause quickly.
The goal isn’t just to know if the business made money. It’s to know which parts of the business generated the highest return and where resources are getting wasted. That clarity shapes budget decisions and strategic bets.
Performance Data Analytics
Underneath every performance insight is a data pipeline. Performance data analytics focuses on that pipeline. It covers how data gets collected, cleaned, and validated before it ever appears in a report.
Messy data leads to bad conclusions. Inconsistent formatting, duplicate entries, and missing values distort the truth. A strong performance data analytics practice prevents garbage-in-garbage-out scenarios.
Visualization is part of this, too. Raw spreadsheets are hard to digest. Charts, heatmaps, and dashboards turn abstract numbers into patterns the human brain can process. Tools like Power BI, Tableau, and Google Data Studio exist for exactly this purpose. The output should always be something a busy manager can glance at and understand in seconds.
Workforce Performance Analytics
Workforce performance analytics shifts the focus to people. It tracks how employees are performing individually and collectively. Productivity metrics, attendance patterns, goal completion rates, and engagement survey scores all feed into the picture.
The value here is proactive. Instead of waiting for annual reviews to discover someone is struggling, you spot trends early. A gradual decline in output or a spike in absenteeism triggers a conversation before it becomes a crisis.
Workforce planning also gets sharper. You can forecast hiring needs based on actual capacity data instead of rough approximations. The result is a more balanced, more supported team that actually hits its targets.
Team Performance Analytics
Team performance analytics zooms in on how groups work together. It measures collaboration, project velocity, and collective goal attainment. Agile teams often use sprint burndown charts. Other groups track milestones and cross-functional dependencies.
The metrics reveal whether a team is truly high-functioning or just busy. A team that delivers consistently on key objectives is healthy. A team with high activity but low output needs support.
This layer is especially useful for department heads who oversee multiple teams. It highlights where to invest coaching resources and which groups deserve recognition.
HR Performance Analytics
HR performance analytics applies data to the employee lifecycle. Recruitment analytics show which sourcing channels produce the best hires. Retention analytics flag departments with troubling turnover rates.
Performance review data, when aggregated, reveals whether your evaluation process is fair and consistent. Learning and development metrics show if training programs actually change behavior. Employee satisfaction surveys, correlated with exit data, often uncover hidden friction points.
The shift from reactive HR to data-driven people operations is one of the biggest leaps a growing company can make. It turns HR from a cost center into a strategic function that directly influences retention and culture.
Marketing Performance Analytics
Marketing performance analytics measures how campaigns contribute to business goals. It goes beyond vanity metrics like page views. You track conversion rates, customer acquisition cost, return on ad spend, and lifetime value.
Attribution models have become more sophisticated. You can see which touchpoints actually influence a sale rather than just which got the last click. That changes how budgets get allocated.
Testing becomes scientific. Instead of arguing about which headline feels better, you run a split test and let the data decide. Iteration cycles shorten. Performance lifts become measurable. Marketing shifts from an art to a discipline.
Sales Performance Analytics
Sales performance analytics gives revenue teams a real-time view of pipeline health. Deal velocity, win rates, average deal size, and rep activity all get tracked. Dashboards make individual and team performance visible at a glance.
Forecasting accuracy improves because you’re not relying on a salesperson’s optimism. You look at historical conversion patterns and current pipeline stage distribution. Revenue predictions become more reliable.
Coaching opportunities emerge from the data too. If a rep has great activity but low close rates, the issue might be in negotiation skills. If another rep closes fast but has small deals, there’s a different conversation to have. Data doesn’t replace coaching. It makes it sharper.
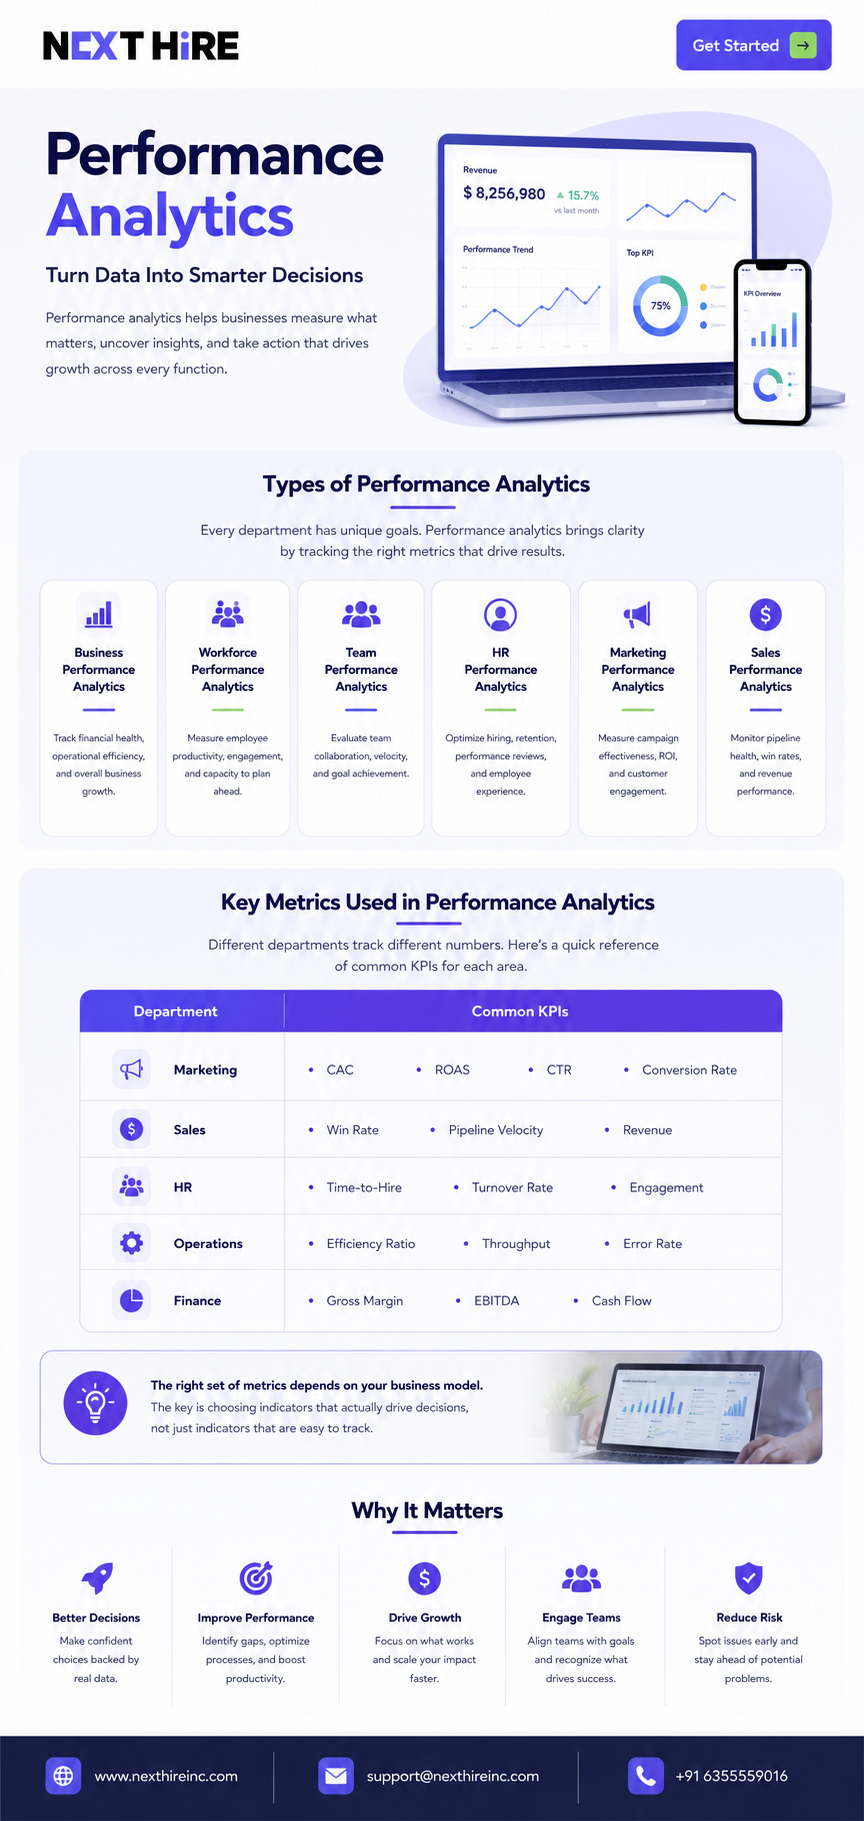
Key Metrics Used in Performance Analytics
Different departments track different numbers. Here’s a quick reference table that shows common KPIs for each area.
| Department | Common KPIs |
| Marketing | CAC, ROAS, CTR, conversion rate |
| Sales | Win rate, pipeline velocity, revenue |
| HR | Time-to-hire, turnover rate, engagement |
| Operations | Efficiency ratio, throughput, error rate |
| Finance | Gross margin, EBITDA, cash flow |
The right set of metrics depends on your business model. The key is choosing indicators that actually drive decisions, not just indicators that are easy to track.
Performance Analytics Tools and Platforms
The tool landscape can feel overwhelming. For business intelligence, Power BI and Tableau dominate enterprise settings. Salesforce Analytics serves revenue teams. Marketing teams lean on Google Analytics, HubSpot, or Adobe Analytics.
HR analytics often lives inside HCM platforms like Workday or specialized tools like Visier. For smaller companies, a well-structured Excel dashboard can still deliver enormous value.
Integration matters more than features. If your CRM doesn’t talk to your marketing platform, you’ll always have blind spots. Pick tools that fit your current size but can scale. The best analytics tool is the one your team actually uses.
AI and Predictive Analytics
By 2026, AI will have moved from buzzword to practical reality in analytics. Predictive models now forecast customer churn, employee flight risk, and inventory needs with remarkable accuracy.
Automated anomaly detection flags unusual patterns without a human needing to scan dashboards every morning. When a metric suddenly deviates from its historical norm, the system pushes an alert. You investigate sooner.
Machine learning finds correlations that traditional analysis misses. Maybe late-stage deal losses spike after product demonstrations exceed 45 minutes. That insight would be hard to spot manually. AI surfaces it. The role of the analyst shifts from data cruncher to strategic interpreter.
How Businesses Use Performance Analytics
Real-world applications make the concept tangible. Retailers use analytics to manage inventory across locations, reducing stockouts and overstock simultaneously. Healthcare organizations track patient outcome metrics to improve care quality while controlling costs.
SaaS companies live on analytics. Churn rates, expansion revenue, and feature adoption all get monitored daily. HR departments use workforce analytics to predict which new hires will succeed based on attributes of past top performers.
Even small marketing agencies use performance analytics to prove ROI to clients. A clear dashboard showing campaign metrics strengthens retention and justifies budgets. Across industries, the pattern is the same: measure what matters, act on what you learn.
The Human Side of Performance Analytics
Data is powerful, but it has limits. Numbers can show you that an employee’s output dropped. They can’t tell you that the employee’s parent just entered hospice care. Analytics reveals correlation. It doesn’t explain the full human context.
The best organizations pair quantitative data with qualitative conversation. A dashboard flags a problem. A manager asks a genuine question. The number starts the dialogue. The human finishes it.
This balance prevents analytics from feeling like surveillance. When teams understand the data exists to support them, not to police them, trust stays intact. Performance analytics works best as a flashlight, not a weapon.
Benefits of Performance Analytics
Organizations that commit to performance analytics gain several concrete advantages. Decision speed increases because leaders don’t have to wait for manual reports. Forecasting accuracy improves, which makes budgeting less stressful.
Productivity tends to rise when people can see how their work contributes to team goals. Revenue optimization happens naturally because you stop investing in activities that don’t yield results. Customer experience also benefits when you measure and respond to satisfaction signals.
Operational waste declines too. Processes that don’t add value become visible and get cut. The cumulative effect is a leaner, more responsive business.
Common Challenges in Performance Analytics
Most analytics efforts stumble on data quality first. If your CRM has duplicate records and your HR system has outdated employee data, the foundation is shaky. Cleaning that up takes time, but skipping it undermines everything else.
Data silos create another headache. Marketing has its numbers. Sales have theirs. They don’t match, and nobody can reconcile them. Integration is a prerequisite for trustworthy cross-functional analytics.
Choosing the wrong KPIs is dangerously easy. You optimize for what you measure. If you measure calls made instead of conversations that advanced a deal, you get busywork. Reporting fatigue also sets in when dashboards multiply faster than decisions get made.
Best Practices for Implementing Performance Analytics
Start with clear business questions. Don’t build dashboards just because you can. Ask what decisions you need to make this quarter and work backward from there. Define three to five KPIs that tie directly to your goals.
Centralize your data wherever possible. The fewer places you have to pull from, the more consistent your reporting will be. Automate reporting so your team spends time interpreting numbers, not building them.
Align analytics with company priorities. If retention is the number one goal this year, your dashboards should make retention metrics front and center. Train people on how to read and act on the data. A beautiful dashboard that nobody understands is worthless.
Future Trends in Performance Analytics
Self-service BI is growing fast. More employees across departments are learning to drill into data without waiting for a specialist. Embedded analytics show insights directly inside the tools people already use, like Slack or their CRM.
Conversational analytics is on the rise. You ask a question in plain language, and the system returns a chart. Real-time streaming data makes batch reporting feel slow. Organizations now expect to see what’s happening right now, not what happened last week.
Predictive workforce analytics will reshape hiring and retention. Companies will anticipate talent gaps before they hurt operations. Cross-platform data ecosystems will connect financial, operational, and people data in ways that make the whole business visible from one vantage point.
Conclusion
Performance analytics is not a software purchase. It’s a commitment to leading with evidence over ego. Every department can benefit from it, from sales teams trying to hit quota to HR teams trying to keep good people.
The companies that outperform their competitors aren’t necessarily the ones with the most data. They’re the ones that ask better questions, track the right signals, and actually act on what they find. AI and predictive tools will only make that advantage sharper.
If you’re ready to build a more data-driven culture at your organization, Nexthire Inc. can help. We work with companies to design performance analytics frameworks that fit their goals and their teams. Let’s stop guessing and start knowing.
Frequently Asked Questions
What is performance analytics?
Performance analytics is the process of collecting, measuring, and analyzing data tied to business goals. It helps organizations understand how well they’re performing and where to improve.
Why is performance analytics important?
It replaces guesswork with evidence. Companies that use analytics well make faster decisions, use resources more efficiently, and spot problems before they escalate.
What are the types of performance analytics?
Key types include business, workforce, team, HR, marketing, and sales performance analytics. Each focuses on a different function but shares the same goal of turning data into action.
What tools are used for performance analytics?
Power BI, Tableau, Salesforce Analytics, and Google Analytics are common. HR teams often use platforms like Workday or Visier. The right tool depends on your size and needs.
How does HR performance analytics work?
It tracks metrics across the employee lifecycle, including hiring sources, retention rates, performance review consistency, and engagement trends. The goal is to improve people’s decisions with data.
What is workforce performance analytics?
It measures employee productivity, attendance, goal attainment, and workforce capacity. It helps leaders spot performance trends and plan headcount more effectively.
How is marketing performance measured?
Marketing analytics tracks conversion rates, customer acquisition cost, return on ad spend, and campaign attribution. It shows which efforts drive actual revenue, not just website visits.
What are the benefits of performance analytics?
Faster decisions, better forecasts, increased productivity, stronger profitability, improved customer experience, and less operational waste are the main benefits. It aligns the whole organization around measurable results.