


Key Takeaways
- Mobile app performance optimization covers everything from startup time and API response speed to memory management, rendering efficiency, and crash reduction.
- Most performance problems have identifiable root causes that can be fixed systematically once you know where to look.
- Platform-specific optimization matters: Android and iOS have different performance profiles, bottlenecks, and tooling.
- UX optimization and technical performance are inseparable. A technically fast app that feels slow because of poor interaction design still drives users away.
- Next Hire Inc provides experienced mobile developers and performance specialists who can audit, diagnose, and fix app performance issues, shortlisted within 24 hours.
Introduction
Users are not patient. Research consistently shows that a significant percentage of users abandon apps that take more than a few seconds to load, and most won’t give a crashing app a second chance after the first bad experience. In competitive app categories, performance is directly tied to retention, ratings, and revenue.
The frustrating part is that most mobile app performance problems are fixable once you know what’s actually causing them. A slow app isn’t usually slow because of one massive problem. It’s slow because of ten medium-sized problems that each add a fraction of a second and together create a noticeably sluggish experience.
This guide covers mobile app performance optimization across its main dimensions: load times, API efficiency, rendering, memory management, crash reduction, UX responsiveness, and platform-specific considerations for Android, iOS, and React Native.
What Is Mobile App Performance Optimization?
Mobile app performance optimization is the process of identifying and resolving the technical and design factors that cause an app to be slow, unstable, or frustrating to use. It covers the full stack: frontend rendering, network communication, backend response times, memory management, battery consumption, and overall UI responsiveness.
App performance optimization isn’t a one-time activity. Every new feature introduces potential performance regressions. OS updates change how resources are allocated. User behavior at scale reveals bottlenecks invisible during development.
Core Performance Metrics at a Glance
| Metric | What It Measures | Target |
| Cold start time | First launch after install or long inactivity | Under 2 seconds |
| Warm start time | Relaunch from background | Under 1 second |
| Frame rate | UI rendering consistency | 60fps consistent |
| API response time (P95) | Server response under load | Under 500ms |
| Memory usage | RAM consumption | Platform appropriate |
| Crash rate | Sessions ending in a crash | Below 0.1% (top tier) |
| Battery drain | CPU and background activity impact | Minimal background use |
When any of these metrics drifts outside acceptable range, users feel it before your monitoring tools catch it.
Why Mobile App Optimization Matters Before and After Launch
There’s a temptation to treat performance optimization as something you do after launch when users start complaining. That’s the more expensive approach.
Performance problems discovered in production affect real users, generate negative reviews, and require deploying fixes through app store review cycles, adding days to the resolution timeline. Performance testers who specialize in mobile load testing can simulate realistic user volumes and identify bottlenecks before a single real user encounters them.
Cost of Fixing Performance Issues by Stage
| Stage | Relative Cost | Risk Level | Notes |
| Architecture planning (pre-development) | Very low | Very low | Cheapest stage to make decisions |
| During development (per sprint profiling) | Low | Low | Caught early, easy to fix |
| Pre-launch (load testing, QA) | Medium | Low | Still controllable |
| Post-launch (user complaints arrive) | High | Medium | Requires app store update cycle |
| After bad reviews go public | Very high | High | Reputation damage compounds cost |
For businesses in retail and ecommerce especially, the connection between app performance and conversion rate is direct and measurable. Slow apps lose sales. Crashing apps lose customers permanently.
Common Causes of Slow Mobile App Load Times
Before fixing anything, you need to understand what’s actually causing the slowness. The fixes depend entirely on the root cause.
Heavy Startup Operations
A common mistake is doing too much work during app startup. Database migrations, heavy initialization logic, synchronous network calls, and large asset loading happening on the main thread before the first screen appears all add to perceived startup time.
The fix: defer non-essential initialization to the background, load only what’s needed for the first screen, and move everything else to lazy loading patterns that execute when the relevant feature is first accessed.
Unoptimized Images and Assets
Images cause a disproportionate share of load time problems. Serving full-resolution images to mobile screens that don’t need them, loading all images in a list upfront, and storing large asset bundles in the app binary all inflate load times unnecessarily.
The solution: serve appropriately sized images for each device, use modern compression formats (WebP on Android, HEIC on iOS), implement lazy loading for list content, and cache images aggressively after first download.
Slow or Excessive API Calls
Apps that make multiple sequential API calls on startup, wait for all data before showing any UI, or fetch more data than the initial view needs impose unnecessary wait time on users.
Better patterns: parallel API calls where possible, progressive data loading that shows partial UI while remaining data loads, pagination that fetches only what’s immediately needed, and caching strategies that serve stale data immediately while refreshing in the background.
Blocking the Main Thread
Mobile UI frameworks are single-threaded for rendering. Any heavy computation, database query, file I/O, or network call that runs on the main thread blocks the UI and causes frames to drop or the interface to freeze.
The rule is straightforward: the main thread handles UI updates only. Everything else happens on background threads, with results posted back when they’re ready.
Inefficient Database Queries
Local database operations without proper indexing, fetching entire datasets when only a subset is needed, or executing multiple sequential queries when a single optimized query would do are all common sources of UI lag.
How to Improve Mobile App Performance
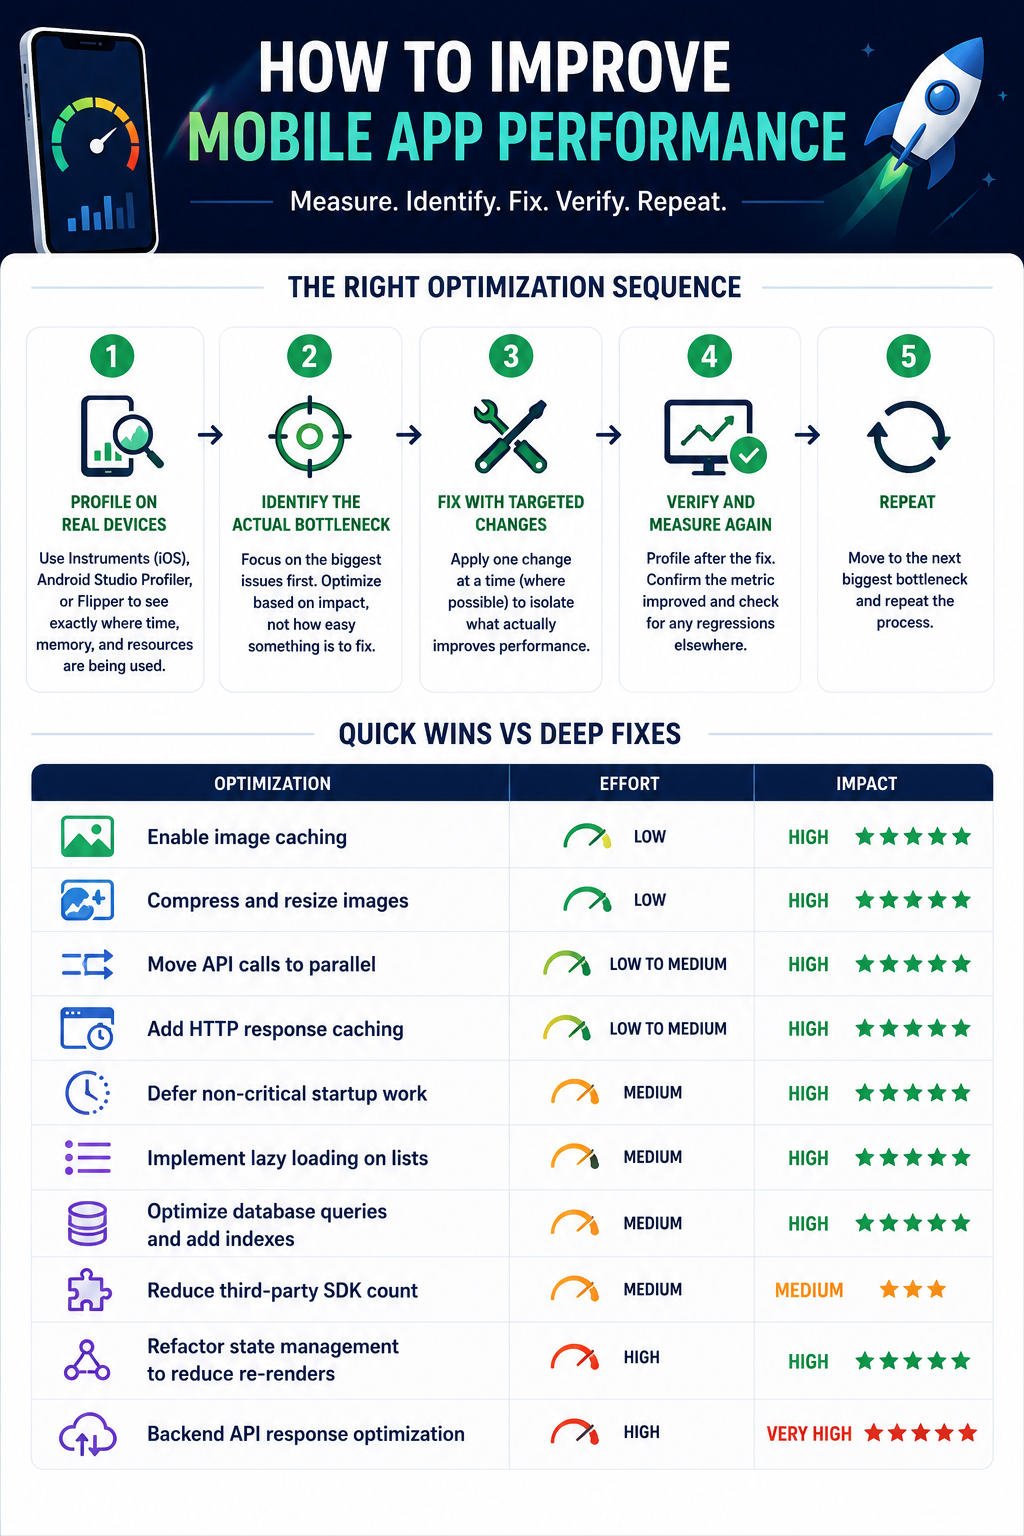
Improving mobile app performance follows one non-negotiable sequence: measure first, identify the actual bottleneck, fix the root cause, verify the improvement, repeat. Optimizing based on intuition is how you spend time on things that don’t matter while the actual problem persists.
The Right Optimization Sequence
Step 1: Profile on real devices
Use Instruments on iOS, Android Studio Profiler on Android, and Flipper on React Native. These show exactly where time is being spent, which views are rendering slowly, where memory is accumulating, and which API calls are taking longest.
Step 2: Identify the actual bottleneck
Optimization effort should be proportional to the size of the bottleneck, not the ease of fixing it. A function that takes 2 seconds matters more than one that takes 50ms, even if the 50ms fix is trivial.
Step 3: Fix with targeted changes
One change at a time where possible. Multiple simultaneous changes make it impossible to know which one helped.
Step 4: Verify and measure again
Profile after the fix. Confirm the metric improved. Check for regressions elsewhere.
Step 5: Repeat
Move to the next biggest bottleneck.
Quick Wins vs Deep Fixes
| Optimization | Effort | Impact |
| Enable image caching | Low | High |
| Compress and resize images | Low | High |
| Move API calls to parallel | Low to medium | High |
| Add HTTP response caching | Low to medium | High |
| Defer non-critical startup work | Medium | High |
| Implement lazy loading on lists | Medium | High |
| Optimize database queries and add indexes | Medium | High |
| Reduce third-party SDK count | Medium | Medium |
| Refactor state management to reduce re-renders | High | High |
| Backend API response optimization | High | Very high |
Backend developers who specialize in mobile APIs understand the specific patterns that make mobile clients faster: response shaping, pagination, incremental loading, and push-based updates that reduce polling frequency.
Mobile App Optimization Techniques That Improve Speed
Lazy Loading and Virtualization
Rather than rendering all list items at once, virtualized lists only render items currently visible on screen. This keeps memory usage manageable and scroll performance smooth regardless of list length.
| Platform | Virtualized List Component |
| Android | RecyclerView |
| iOS | UITableView / UICollectionView |
| Flutter | ListView.builder |
| React Native | FlatList / FlashList |
FlashList from Shopify is worth mentioning specifically for React Native. It’s significantly faster than FlatList for large lists, particularly on Android.
Efficient State Management
Poorly implemented state management causes unnecessary re-renders that drop frames. In React Native, components that re-render when unrelated state changes consume CPU unnecessarily. Using React.memo, useMemo, and useCallback correctly, and selecting only the state a component actually needs from global stores, all reduce render overhead.
On native platforms, the same principle applies: avoid invalidating views or reloading table sections when underlying data hasn’t changed.
Background Processing
Work that doesn’t need to happen synchronously with user interaction should move to the background:
- Analytics event batching rather than immediate dispatch
- Image processing and compression after upload
- Data sync operations during idle periods
- Report generation queued as background tasks
- Email and notification queuing
Both iOS and Android have background task APIs that allow work to be scheduled intelligently based on device state, network availability, and battery level.
Network Request Optimization
Reducing the number of network requests and the size of each one has compounding benefits. Key techniques:
- Request batching: combine multiple small requests into one
- Response compression: gzip or Brotli encoding
- Connection reuse via HTTP/2
- WebSockets for real-time features instead of polling
- Conditional requests with ETags to skip unchanged data
How to Reduce App Crashes and Improve Stability
Crashes are the most visible performance problem because they’re binary: the app either works or it doesn’t. A crash rate above 1 percent is worth treating as high priority.
Crash Rate Benchmarks
| Crash Rate | Status | Required Action |
| Below 0.1% | Excellent | Maintain and monitor |
| 0.1% to 0.5% | Good | Keep an eye on trends |
| 0.5% to 1% | Acceptable | Prioritize known crashes |
| 1% to 2% | Poor | Treat as high priority bugs |
| Above 2% | Critical | Immediate attention needed |
Most Common Crash Causes
Null pointer exceptions and force unwraps. Accessing a value that doesn’t exist is one of the most common crash causes across platforms. Swift’s optional system and Kotlin’s null safety address this, but the failure mode is over-relying on force unwraps in code paths where null is actually possible.
Memory pressure crashes. When an app consumes more memory than the OS will allocate, it gets terminated. This is common in apps that load large images without releasing them or that cache data indefinitely without limits.
Threading issues. Accessing UI components from background threads, race conditions in concurrent operations, and deadlocks all cause crashes that are difficult to reproduce because they’re timing-dependent.
Unhandled exceptions. Network requests, file access, and JSON parsing can all fail. When they do and there’s no error handling, the exception propagates up and crashes the app.
Third-party SDK crashes. SDKs from analytics providers and advertising networks have their own crash rates. Keep SDKs updated, audit which ones you actually need, and monitor whether crash spikes correlate with SDK updates.
Automation testers who build comprehensive test suites catch many crash-causing conditions before they reach production. This is particularly effective for regression crashes where a code change breaks something that previously worked.
Mobile App UX Optimization for Better User Experience
Technical performance and UX optimization are not the same thing, but they’re deeply related. An app can be technically fast but feel slow because of poor interaction design.
Perceived Performance vs Actual Performance
| Concept | What It Means | Example |
| Actual performance | What the profiler measures | API call takes 800ms |
| Perceived performance | How fast the app feels to users | With optimistic UI, the same call feels instant |
You can meaningfully improve perceived performance without changing actual performance numbers.
Optimistic UI updates. When a user performs an action, update the UI immediately as if the action succeeded, then sync with the server in the background. If the request fails, roll back and show an error. The interaction feels instant.
Skeleton screens. Show the structure of content before data arrives. Users perceive a layout with placeholder content as faster than a loading spinner because they can see progress happening.
Progressive loading. Show whatever data you have immediately and fill in additional detail as it loads. A list that shows the first ten items while the rest load feels faster than a list that shows nothing until everything is ready.
Immediate visual feedback. Every tap, swipe, and input should produce immediate visual feedback. Buttons that appear not to respond make users tap again, sometimes causing duplicate actions or confusing state.
Animation and Transition Optimization
Animations that drop frames (below 60fps) look choppy and make the app feel lower quality than it is. The key principle: animate transform and opacity properties, not layout properties. Transform-based animations run on the GPU without requiring the CPU to recalculate layout on every frame.
Offline UX
Apps that fail completely when the network is unavailable provide a poor experience for users on unreliable connections. Good offline UX:
- Shows cached content when the network is unavailable
- Clearly indicates connection status without alarming the user
- Queues actions taken offline for sync when connection returns
- Never loses user input because of a connectivity drop
UX researchers who conduct usability testing on real devices with real users identify interaction problems that don’t show up in any profiling tool.
Android App Performance Optimization
Android has unique challenges that iOS doesn’t, primarily because of device fragmentation.
Android-Specific Performance Challenges
| Challenge | Root Cause | How to Address |
| Device fragmentation | Thousands of hardware configs, varying RAM and CPU | Test on budget devices, not just flagships |
| GC pauses | Garbage collector briefly pauses execution | Reduce object allocation in hot code paths |
| ANR (App Not Responding) | 5-second main thread block triggers dialog | Move all heavy work to background threads |
| Large APK size | Slower downloads, longer first launch | Use App Bundles, remove unused resources |
| Battery drain | Over-aggressive background work | Use WorkManager, respect Doze mode |
RecyclerView Optimization
RecyclerView is the most common source of scroll performance problems in Android apps. Key fixes:
- Implement DiffUtil for efficient list updates instead of notifyDataSetChanged()
- Use getItemLayout() when item heights are known in advance
- Avoid complex view hierarchies in list item layouts
- Never load images synchronously in onBindViewHolder
- Use setHasStableIds(true) when item IDs are stable
Android Profiling Tools
| Tool | What It Measures |
| Android Studio Profiler | CPU, memory, network, energy in real time |
| Android Vitals (Play Console) | Crash rate and ANR rate from real production users |
| Perfetto | System-level performance traces |
| LeakCanary | Memory leaks in debug builds |
| Strict Mode | Disk and network calls on main thread during development |
Android developers proficient with Kotlin Coroutines write async code that keeps the UI thread available for rendering rather than blocking it with database or network operations.
iOS App Performance Optimization
iOS has a more predictable device environment but its own performance considerations that are distinct from Android.
iOS Profiling Tools
| Tool | Purpose |
| Instruments: Time Profiler | Shows which functions consume the most CPU time |
| Instruments: Core Animation | Frame rate, dropped frames, expensive view redraws |
| Instruments: Leaks | Memory leaks and retain cycles |
| Instruments: Network | API call timing and payload size breakdown |
| Main Thread Checker | Detects UIKit calls from background threads during development |
| MetricKit | Production performance data from real opted-in devices |
SwiftUI vs UIKit Performance
SwiftUI can cause unexpected re-renders when observed state changes, which affects performance in complex UIs. Understanding which parts of a SwiftUI view hierarchy re-render when state changes and using StateObject, ObservedObject, and EnvironmentObject appropriately is important for smooth SwiftUI performance.
Swift developers who understand both SwiftUI and UIKit make informed choices about which to use for performance-sensitive parts of the UI rather than defaulting to one framework for everything.
Apple also measures app launch time and in some cases shows it to users on the App Store. Reducing the number of frameworks loaded at startup and deferring initialization of frameworks not needed for the first screen are the most direct ways to improve launch time.
React Native App Performance Optimization
React Native has a unique performance profile because JavaScript business logic runs on a separate thread from the native UI.
React Native Threading Model
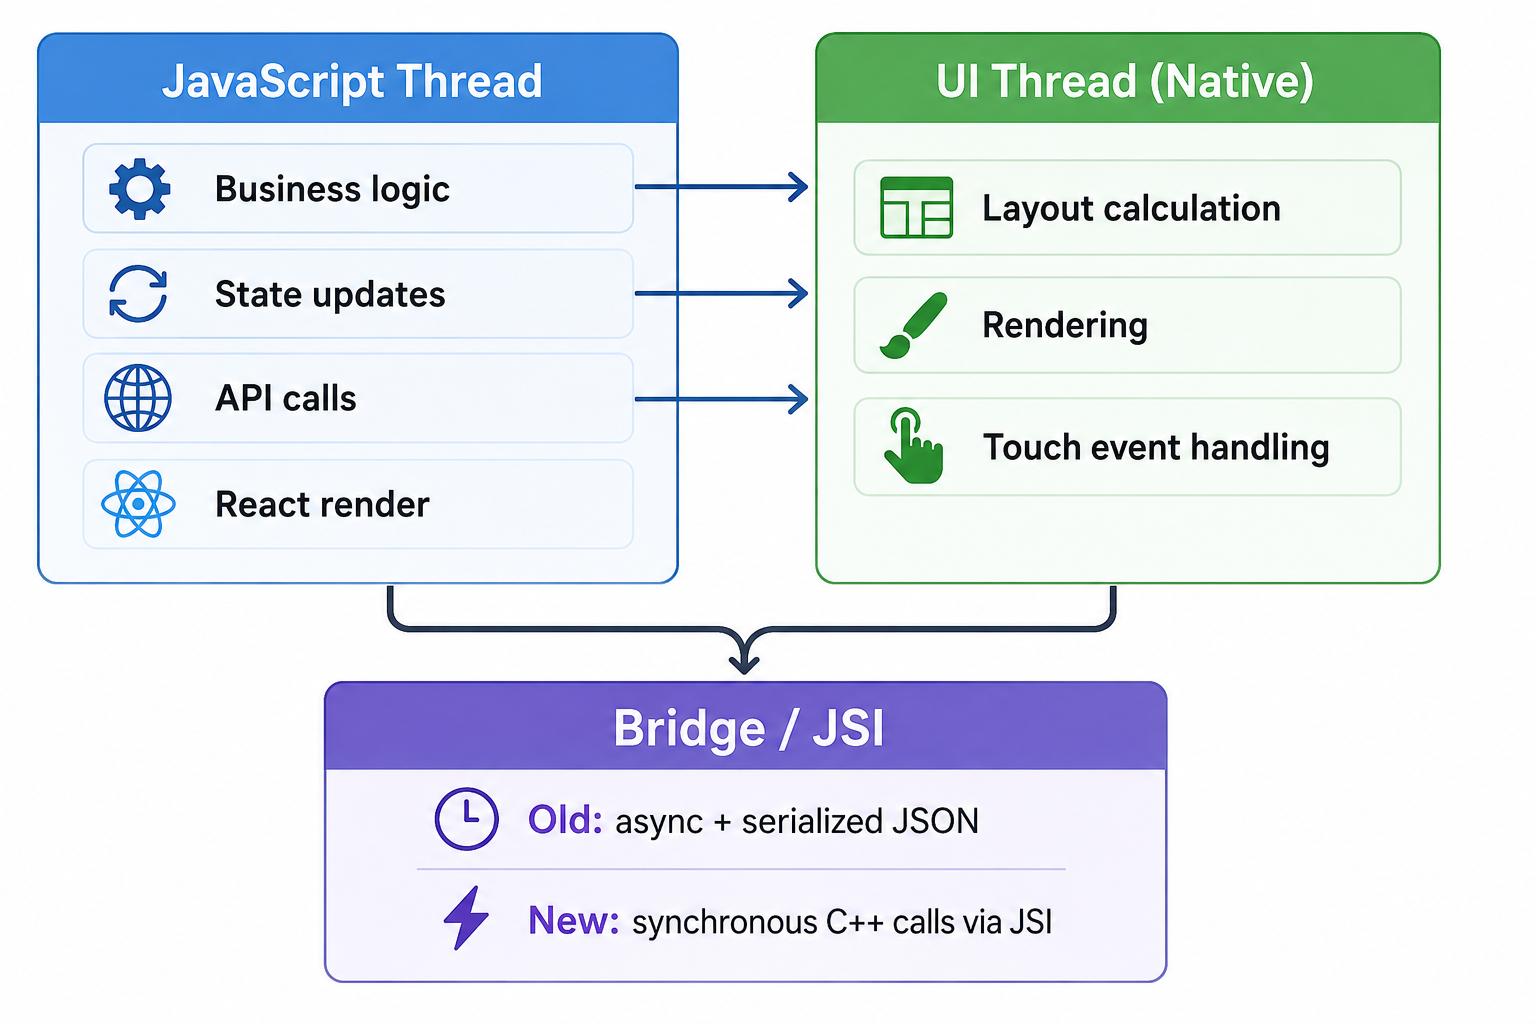
Heavy JavaScript work blocks the JS thread and delays UI updates. Frequent bridge crossings with large data payloads slow everything down.
Old vs New React Native Architecture
| Feature | Old Architecture (Bridge) | New Architecture (JSI + Fabric) |
| JS-to-Native communication | Asynchronous, serialized JSON | Synchronous, direct C++ calls |
| Animation at 60fps | Limited for gesture-driven animations | Full support |
| Module initialization | All at startup | Lazy, on demand |
| Memory overhead | Higher | Lower |
| Available from | RN 0.60+ | RN 0.71+ (opt-in) |
Common React Native Performance Fixes
| Problem | Symptom | Fix |
| Unnecessary re-renders | JS thread busy, UI lagging | React.memo, useMemo, useCallback |
| Heavy JS on tap | Delayed response to user input | Move to worklets with Reanimated |
| Large FlatList | Scroll jank on long lists | Switch to FlashList |
| Choppy navigation | Dropped frames on screen transitions | React Navigation with native stack |
| Hermes not enabled | Slower startup, higher memory | Enable in build configuration |
Hermes JavaScript Engine pre-compiles JavaScript to bytecode at build time, eliminating the runtime parsing step that slows cold starts. It’s the default in recent React Native versions. If you’re on an older version, enabling it is one of the easiest performance wins available.
React developers who work in React Native regularly apply these patterns proactively rather than discovering them through production performance complaints.
Mobile App Optimization Tools and Software
Production Monitoring Tools
| Tool | Platform | Best For | Cost |
| Firebase Performance | iOS, Android, Flutter | Real user performance traces | Free |
| Firebase Crashlytics | iOS, Android, Flutter | Production crash tracking | Free |
| Sentry | All including React Native | Cross-platform error and performance tracking | Free tier + paid |
| Datadog | All | Enterprise monitoring and APM | Paid |
| New Relic | All | Enterprise observability | Paid |
Network Analysis Tools
| Tool | What It Does |
| Charles Proxy | Intercepts and inspects all HTTP/HTTPS traffic from device |
| Proxyman | macOS-native alternative to Charles with cleaner UI |
| Network Link Conditioner | Simulates poor network conditions for realistic testing |
CI/CD Performance Integration
Bitrise and Fastlane can run performance benchmarks automatically on every code change, catching regressions before they reach production. This turns performance monitoring from a reactive activity into a proactive one.
Performance Optimization as an Ongoing Discipline
The most effective mobile app optimization programs treat performance as a continuous discipline, not a periodic activity.
Performance budgets. Define acceptable thresholds for key metrics. When a metric exceeds its budget, treat it as a bug to fix before the next release rather than something to revisit eventually.
Automated performance testing. Automation testers build performance benchmarks that run automatically in CI/CD pipelines, flagging regressions before they reach production.
Regular profiling sessions. Schedule profiling on real devices as part of the development cycle, not just when performance complaints arrive.
Production monitoring review. Firebase Performance, Crashlytics, and Sentry provide ongoing visibility. Review them on a schedule, not just when something breaks.
Device testing matrix. For Android especially, test on a range of devices including budget models. Performance invisible on a flagship can be severe on a budget device.
Understanding performance analytics as a discipline helps teams build measurement practices that make optimization systematic rather than reactive.
How Next Hire Inc Helps With Mobile App Performance Optimization
Performance problems require specialists who know where to look and how to fix what they find. Next Hire Inc provides access to experienced mobile developers, performance testers, and platform specialists who can audit existing apps, identify root causes, and implement fixes.
Available Specialists for Performance Work
| Role | What They Contribute |
| iOS developers | Instruments profiling, SwiftUI optimization, memory leak fixes |
| Android developers | RecyclerView tuning, Kotlin Coroutines, ANR elimination |
| React Native developers | Re-render reduction, Reanimated migration, Hermes enablement |
| Flutter developers | Widget rebuild optimization, isolate usage, rendering fixes |
| Performance testers | Load testing, benchmark establishment, regression detection |
| Automation testers | Test coverage that catches crash-causing conditions pre-launch |
| Backend developers | API response optimization, caching, query performance |
| Security test engineers | Security audits that often catch stability issues alongside vulnerabilities |
Engagement Model
| Detail | What to Expect |
| Candidate shortlist | Within 24 hours of sharing requirements |
| Engagement start | 24 to 48 hours after approval |
| Trial period | 3-day free trial to evaluate fit |
| Pricing | From $5/hour, monthly from $799/month |
| Account management | Dedicated account manager throughout |
| Backup coverage | Backup resource if primary is unavailable |
Full details on the pricing page.
Every candidate is pre-vetted for technical skills, communication ability, and reliability. The infrastructure supporting engagements is designed for continuity and security.
Next Hire Inc works with businesses across technology, retail and ecommerce, healthcare, finance, education, and logistics.
For teams building new apps, combining performance work with mobile app architecture planning from the start prevents most performance problems that require expensive fixes later. For teams dealing with stability issues, the mobile app security testing checklist is worth reviewing alongside performance work since many security and stability fixes overlap.
Dealing with slow load times, crashes, or poor performance in your mobile app? Next Hire Inc shortlists experienced performance specialists within 24 hours. Tell us what you need.
Frequently Asked Questions
What Is Mobile App Performance Optimization?
Mobile app performance optimization is the process of identifying and resolving technical and design factors that cause slow load times, poor rendering, excessive memory usage, crashes, or poor user experience. It covers the full stack from frontend rendering to backend API response times.
How Do I Improve Mobile App Performance?
Profile first to identify actual bottlenecks. Common improvements include: deferring startup operations, running API calls in parallel, implementing caching, reducing unnecessary re-renders, moving heavy work off the main thread, and optimizing images and database queries.
What Causes Mobile Apps to Crash?
Common causes include null pointer exceptions and force unwraps on potentially null values, memory pressure from unmanaged allocations or leaks, threading issues where UI is accessed from background threads, unhandled exceptions in network or file operations, and crashes in third-party SDKs.
What Is a Good Crash Rate for a Mobile App?
Below 0.1 percent is excellent for top-tier apps. Below 1 percent is generally acceptable. Above 2 percent typically shows up in App Store ratings and user reviews in a visible way.
How Is Android Performance Optimization Different from iOS?
Android requires testing across a much wider range of devices. Budget devices with less RAM and slower CPUs reveal issues invisible on flagship hardware. iOS has a more predictable device matrix but requires familiarity with Xcode Instruments and Apple’s specific platform APIs.
What Tools Are Used for Mobile App Performance Optimization?
Xcode Instruments for iOS, Android Studio Profiler for Android, Flipper for React Native, Firebase Performance Monitoring and Crashlytics for production monitoring, Sentry for cross-platform tracking, and Charles Proxy or Proxyman for API analysis.
Can Backend Problems Cause Mobile App Performance Issues?
Yes, frequently. Slow API responses, large payloads, excessive calls, and missing backend caching all manifest as slow or unresponsive UI in the mobile app. Effective optimization often requires addressing both the client and the server.
Conclusion
Mobile app performance optimization is not a single fix or a one-time project. It runs throughout the development lifecycle, from architecture decisions made before the first line of code through ongoing production monitoring after launch.
Most performance problems have identifiable causes and practical solutions. Profiling tools tell you where time is being spent. Crash reporting tells you what’s going wrong and for whom. The patterns for fixing the most common issues are well understood and consistently applicable across platforms.
What separates apps that perform consistently well from those that don’t is usually two things: treating performance as an ongoing concern rather than a pre-launch checklist, and having developers who can read profiler output and translate it into targeted, effective fixes.
Ready to improve your mobile app’s performance with experienced developers who can start this week? Try Next Hire Inc with a 3-day free trial.



